
An investment as good as gold.
From $860K to $16.3M quarterly in 11 quarters — and a path to $49.5M in 2027.
Built by operators who've done it before.
We don't just have a vision — we have the relationships, retail know-how, and operational infrastructure to execute at scale.
Founder and driving force behind Coco Love for 12+ years. Grew the brand from zero to $5.76M in 2025 — entirely bootstrapped with no prior institutional capital. Holds a U.S. patent on a zero-waste coconut water processing system. Featured on CNBC's #TheProfit and ABC's Shark Tank. Personally built the B2B distribution network serving cruise lines, Walmart, 5-star resorts, and festivals nationwide. Scaled from $860K to $16.3M quarterly in 11 quarters.
Multi-time C-Suite operator with a track record scaling consumer brands from early growth to national distribution. Leads Coco Love's brand strategy, retail activation, digital marketing, and demand generation. Pioneer in AI architectural stacking — deploying integrated AI systems across marketing operations, data pipelines, and customer acquisition to compound growth velocity. Prior experience spans CPG, retail, and technology sectors with measurable outcomes across multiple successful exits and brand transformations.
Seasoned CPG operator with deep national retail and foodservice distribution experience. Leads Coco Love's day-to-day execution, key account management, and national expansion strategy. Brings hands-on relationships across major retail chains, DSD networks, and foodservice distributors. Responsible for operationalizing the path from $18M (2026) to $49.5M (2027) — overseeing supply chain coordination, distributor onboarding, and key account programs.
Key hires funded by the $25M
The $25M raise funds critical leadership additions: VP of Supply Chain (Q3 2026), CFO / VP Finance (Q3 2026), Director of National Accounts (Q4 2026), and a 5-person field sales force for retail activation (Q4 2026 – Q1 2027). These hires are budgeted within the G&A and Sales & Distribution lines of the Use of Funds.

Exponential growth, quarter after quarter.
A $10B+ market growing 15% annually — and we're already in it.
Coconut water is the fastest-growing segment in functional beverages. Coco Love is positioned at the intersection of premium, health-conscious, and natural beverage trends.
Tailwinds
- →Health-conscious shift driving double-digit growth in natural beverages
- →Post-pandemic hydration awareness accelerating premium water adoption
- →Cruise-line model proving enterprise foodservice as high-volume recurring revenue
- →Walmart velocity validating mainstream consumer demand
Competitive Moat
- →First-mover in premium 100% coconut water never from concentrate
- →Cruise-line-validated product quality — institutional quality bar
- →Proprietary supply chain and co-packer relationships protecting margins
- →Brand equity built through 1,800% organic growth — no paid growth gimmicks
Revenue scales. Margins expand. Profit compounds.
From $5.76M in 2025 to a projected $49.55M in 2027 — gross profit climbing from $2.98M to $24.55M, proving durable unit economics and operating leverage.

Profitable in 2026. Compounding into 2027.
What's powering the margin expansion.
45–50% sustained, with room to climb.
Sustained 45–50% gross margin range expected with continued volume growth and operational efficiency gains.
Operating leverage will continue to drive margin expansion as we scale toward $100M+ annual revenue.

From operating loss to $13.9M in operating income.
Revenue compounds, gross margins expand, and operating leverage flips the business from cash-burn in 2025 to substantial profitability by 2027.
Operating leverage at scale.
| Category | 2027 amount | % of revenue |
|---|---|---|
| Sales & Marketing | $4.2M | 8.5% |
| G&A — Finance, Legal, HR | $2.1M | 4.2% |
| Headcount & People (~25 FTEs) | $3.1M | 6.3% |
| D&A and Other | $1.3M | 2.6% |
| Total OpEx | $10.7M | 21.6% |
OpEx as a percentage of revenue declines from ~55% in 2025 to ~21.6% in 2027, demonstrating significant operating leverage at scale.
Margin per case drives the mix-shift strategy.
Enterprise accounts generate 32% higher margin per case than retail — driving the mix-shift strategy toward institutional buyers.
Founder-controlled. Zero institutional capital to date.
Coco Love has been entirely bootstrapped to $5.76M in 2025 revenue — no prior institutional capital, no convertible notes, no SAFEs outstanding. This $25M raise is the company's first formal institutional funding round. The current cap table is founder-controlled. A complete cap table is available in the data room under NDA.
From $18.2M to $49.5M — every dollar accounted for.
Every dollar of 2027 revenue is backed by a named account or contracted channel.
| Driver | Incremental revenue |
|---|---|
| Existing Walmart velocity | +$8.5M |
| Cruise-line expansion (2027) | +$12.0M |
| New retail chain onboardings (3 chains, Q2-2027) | +$6.5M |
| Foodservice and hospitality expansion | +$4.4M |
| Total incremental ($18.2M → $49.5M) | +$31.4M |

Enterprise accounts. Retail velocity. Repeatable wins.
Q2-2025 pilot revenue validated enterprise product-market fit and unlocked institutional demand.
The cruise-line channel began with a $475K Q2-2025 pilot and is currently active across multiple lines, with expansion targeted through 2026 and 2027. Cruise lines represent Coco Love's highest-margin channel at approximately 58% gross margin, validating the enterprise-first strategy.
From regional pilot to national accounts with consistent quality and supply-chain control.
Q4-2026 channel mix.
No single customer exceeds 30% of revenue. Target: no customer above 20% by end of 2027.

+302% YoY at Walmart. Velocity that validates the path.
Accounts for 71% of total sales despite being in only 20% of stores.
Combined sales of $3,447 (14% share) across an 80/64 store-count mix.
Current velocity validates the projected path to $49.5M revenue in 2027.
27 distributor partners. 18 states live. National coverage in motion.
Coco Love now ships through the three largest US beverage networks — Anheuser-Busch, Pepsi, and Coors — plus a curated set of independent DSD operators. Each colored territory below is an active, contracted distributor moving product weekly as of June 30, 2026.
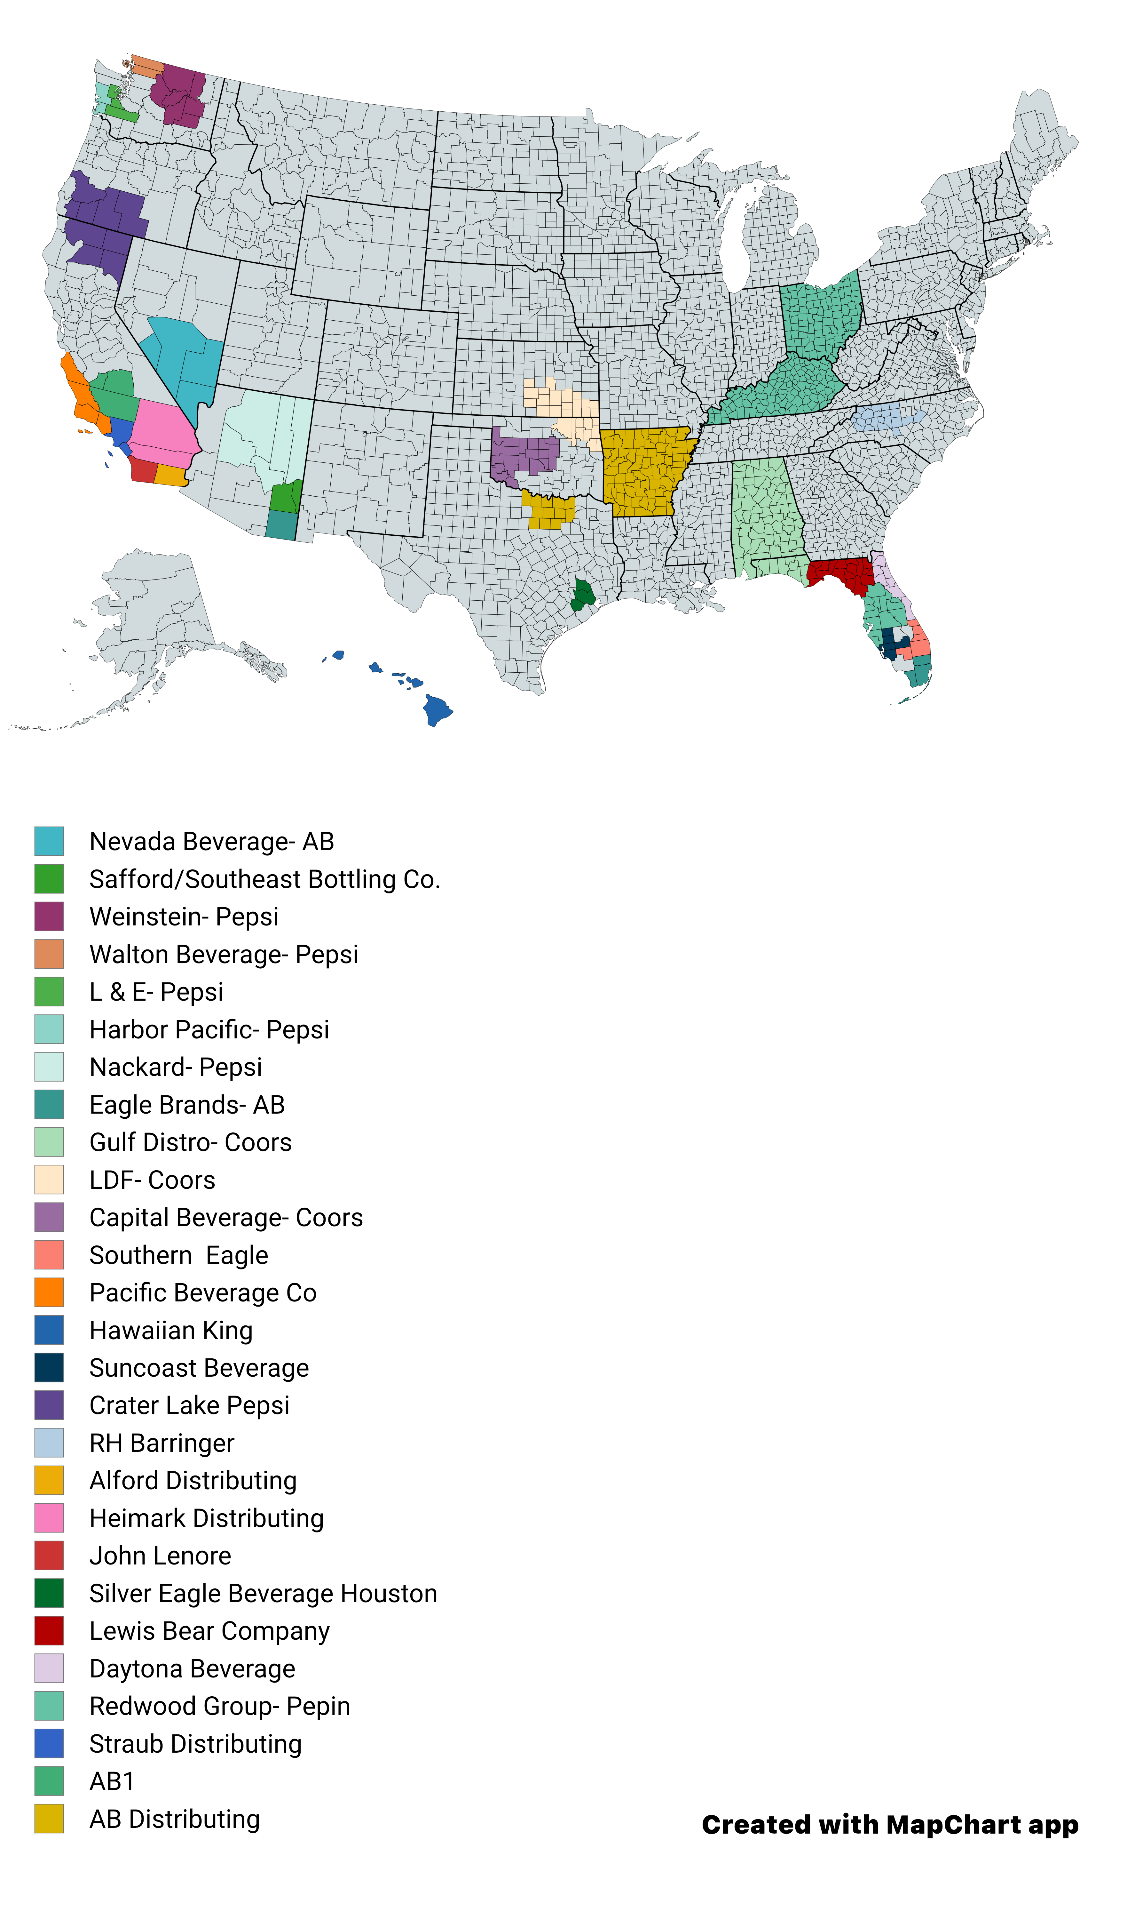
Filling in the Midwest, Mid-Atlantic, and Northeast to unlock the $49.5M national run-rate.
Regional momentum by market cluster.
Hawaiian King · Pacific Beverage · Harbor Pacific-Pepsi · Crater Lake Pepsi · Walton Beverage-Pepsi
Hawaii is our highest-velocity market — hotel, resort, and specialty grocery pull. Oregon and Washington Pepsi houses added in Q1-2026.
John Lenore · Straub Distributing · Nevada Beverage-AB · Nackard-Pepsi · L&E-Pepsi
SoCal DSD anchored by John Lenore and Straub. Nevada Beverage (AB) expansion into Las Vegas hospitality drove 3× volume in Q2.
Weinstein-Pepsi · Capital Beverage-Coors · Safford/Southeast Bottling
Idaho, Utah, and Colorado added in early 2026. Coors partnership unlocked chain grocery placement across the Rockies.
Alford Distributing · LDF-Coors · AB Distributing · Silver Eagle Beverage Houston
Arkansas, Oklahoma, and Texas are the fastest-scaling cluster — powered by Walmart HQ market pull-through and Silver Eagle Houston activation.
Gulf Distro-Coors · Lewis Bear Company · Eagle Brands-AB · RH Barringer
Kentucky, Tennessee, Alabama, Mississippi, and North Carolina live. Lewis Bear anchoring the Florida Panhandle with hospitality accounts.
Suncoast Beverage · Southern Eagle · Daytona Beverage · Redwood Group-Pepin · AB1
Five distributors covering the entire state — the densest coverage in our network. Resort, cruise, and c-store channels all active.
Uncontracted territory — including the entire Midwest, Mid-Atlantic, and Northeast corridor.
Five priority DMAs in active distributor conversations for H2-2026 activation.
Distributor onboarding, slotting, and inventory to activate the next 13 states from the $25M raise.
Source: Coco Love distributor operations · Coverage map as of June 30, 2026. YoY growth measured on shipped case volume by region, June 2025 vs June 2026.
The full picture.
| Quarter | Revenue | Gross Profit | Gross Margin | Net Op. Income |
|---|---|---|---|---|
| Q1-2025 | $859.7K | $529.5K | 61.6% | -$41.3K |
| Q2-2025 | $1,539.1K | $940.7K | 61.1% | +$278.3K |
| Q3-2025 | $1,540.1K | $504.2K | 32.7%* | -$246.2K |
| Q4-2025 | $1,822.0K | $1,008.3K | 55.3% | -$443.0K |
| Q1-2026 | $1,240.2K | $632.3K | 51.0% | -$538.0K |
| Q2-2026 | $2,411.8K | $1,053.1K | 43.7% | -$224.3K |
| Q3-2026 | $5,238.1K | $2,387.1K | 45.6% | +$780.1K |
| Q4-2026 | $9,284.0K | $4,457.9K | 48.0% | +$2,496.5K |
| Q1-2027† | $7,174.1K | $3,553.5K | 49.5% | +$1,642.0K |
| Q2-2027† | $12,675.2K | $6,279.5K | 49.5% | +$3,579.2K |
| Q3-2027 | $13,355.2K | $6,616.5K | 49.5% | +$3,796.7K |
| Q4-2027 | $16,341.0K | $8,096.1K | 49.5% | +$4,835.6K |
* Q3-2025 gross margin reflects a one-time co-packer transition and promotional pricing investment. Normalized gross margin ex-transition: ~55%. Deliberate growth investment, not a structural margin issue.
† Q1-2027 reflects post-holiday seasonal softness in foodservice; Q2-2027 ramp driven by cruise-line expansion and 3 new retail chain activations.
Source: Monarch Media P&L · Updated June 2026. Actuals through May 2026; June and H2 2026 represent management forecasts. May 2026 revenue tracking ahead of Q2 forecast.

Join the growth journey.
Our $49.5M 2027 forecast is anchored in actuals — and well under pipeline capacity. We're raising to unlock the rest.
Inventory and receivables to support 200% revenue growth.
National retail activation and distributor partnerships.
Scaling manufacturing to meet enterprise demand.
Backed by actuals, anchored in pipeline. Join us on the path to $49.5M in 2027.
Investment Terms
* Terms are indicative. Final terms in the formal subscription agreement. This is not an offer to sell securities.
Why $100M pre-money
The $100M pre-money valuation represents approximately 5.5× projected 2026 revenue of $18.2M — still a meaningful discount to category acquisition precedents. Comparable exits (Vita Coco IPO at 7.5× revenue; Harmless Harvest acquired at 8–10× revenue; ZICO at strategic premium) establish a $150M–$250M valuation range at comparable revenue scale. The $100M entry point represents a compelling risk-adjusted opportunity for investors seeking exposure to the fastest-growing premium coconut water brand in the U.S., backed by institutional accounts and auditable revenue growth.
How Coco Love Compares to Category Exits
We've stress-tested the thesis.
Every growth story carries risk. Here's how we've identified and mitigated the key ones.
Cruise lines and Walmart represent a significant portion of current revenue. Loss of a major account creates revenue volatility.
Actively diversifying across 5+ retail chains and regional foodservice. No single customer will exceed 30% of revenue by end of 2026.
Coconut water is an agricultural commodity subject to harvest variability and logistics disruptions. Margin compression is possible.
Multi-source co-packer agreements and 90-day finished goods buffer. Our 49.5% margin target is modeled on conservative commodity pricing.
Scaling from $18M to $49.5M in one year requires flawless execution across supply chain, distribution, and team capacity.
Already proven: $860K to $16.3M in quarterly revenue with no stockouts. The $25M raise is specifically designed to fund this execution.
Major brands (Vita Coco, ZICO, Harmless Harvest) have larger marketing budgets and distribution advantages.
Enterprise-first strategy targets institutional buyers who value quality over marketing spend. Cruise-line and retail validation create a higher barrier than consumer advertising alone.
Raising a $25M growth fund.
Capital to convert proven traction into category leadership — funding inventory, retail activation, production scale, and the team to execute on a $49.5M 2027 plan.
- Raw materials / ingredient inventory$4.0M
- Finished goods buffer stock$3.0M
- Accounts receivable bridge$2.0M
- Packaging & co-packing deposits$1.0M
- Co-packer expansion & new lines$2.5M
- Automation & quality systems$2.0M
- R&D / new SKU development$1.0M
- Cold chain & fulfillment infra$0.5M
- Slotting fees & shelf placement$2.0M
- In-store demos & field marketing$1.5M
- Digital / social / brand media$1.0M
- Trade marketing & promotions$0.5M
- Key account managers & brokers$1.0M
- DSD network buildout$0.75M
- Distributor incentives$0.5M
- Sales tools & CRM$0.25M
- Finance, legal & compliance$0.5M
- Operations & HR$0.5M
- Working capital reserve$0.5M
Equity snapshot
- Pre-money valuation
- $100,000,000
- Post-money valuation
- $125,000,000
- Security
- Equity in Monarch Media LLC
- Use of proceeds
- Inventory, distribution, working capital, national growth
Coco Love is the consumer brand operated under Monarch Media LLC, the parent entity holding all brand IP, cruise-line and Walmart relationships, co-packer agreements, and operations. Corporate structure chart available in the data room.
$25M investment
Approximately 20.00% of the company on a fully diluted basis, assuming a total investment of $25,000,000 at a $100M pre-money / $125M post-money valuation.
Schedule a Call
Speak directly with the founder. 30-minute investor discovery calls available.
Book a Call →Download the Deck
Full PDF pitch deck with all financials, validation, and use of funds.
This presentation is for informational purposes only and does not constitute an offer or solicitation to purchase securities. Past performance is not indicative of future results. Projections are forward-looking statements based on management estimates.
Forward-Looking Statements
Certain matters discussed in this presentation and any attachments provided by the company may constitute “forward-looking statements.” These forward-looking statements, which speak only as of the date they are made, are inherently uncertain as they involve future events. Similarly, statements that describe the company and/or the managers’ future plans, objectives or goals are also forward-looking statements, which generally involve known and unknown risks, uncertainties and other factors, including, but not limited to, those associated with dependence upon key personnel, the executive team, board of directors, conflicts of interest of the parties, risks associated with an investment in the company, market volatility, as well as the overall risks in the financial markets that may cause the actual results, performance or achievements of the company to be materially different from those expressed or implied by such forward-looking statements. The company does not undertake any obligation to update or revise these forward-looking statements to reflect events or circumstances after the date of the presentation, or to reflect the occurrence of an unanticipated event.